Tire Pressure Part 2: Are Wider Tires Stiffer?Updated 8 months ago
In Part 1, we discussed actual tire width, specifically how it was affected by the bead seat width of the rim, and also how it was generally NOT equal to the number printed on the sidewall.
In part 2, we are going to look specifically at how tire width affects stiffness by measuring the vertical stiffness (more specifically, the vertical force at a given displacement) of various mounted and inflated tires.
Is wider stiffer/Harsher?
The initial design of this test was to show that larger-diameter tires are actually Stiffer/Less Comfortable when inflated to the same pressure. This is due to an effect known as ‘Casing Tension’ and is caused by the internal air pressure acting on a larger surface area in the larger tire. Essentially, the same pressure acting on more surface area makes for higher casing tension. The best explanation of Casing Tension we’ve seen was done by our friends at FLO Wheels and can be found HERE if you are interested!
For this part of the discussion, we used an Instron machine to look at the force required to deflect tires at various pressures and widths. To keep things (relatively) simple, we will refer to the tires by the number printed on the sidewall while also mentioning the pressure used and the rim bead seat width. You can refer back to the chart in Part 1 if you are interested in the actual sizing for comparison to other tire models and brands.
An Instron machine is a large H-shaped piece of lab equipment that can drive the center beam of the H up and down with extreme accuracy while measuring either tension or compression on an object in the middle. Chances are that if you ever see anybody say that part A is X% stiffer/stronger/more elastic than part B, the numbers were generated in one of these machines.

The Test Machine with 8mm Anvil In Place (photo not taken during actual testing)
For this test, we used a solid steel wheel-holding fixture bolted to the base of the machine and 3 different test anvils to push on the tires. We tested tire stiffness against a Flat Surface, an 8cm radius Cobble Surface, and an 8mm radius Bump Surface.
Below are the actual measurements of the 3 Tires on the rim used for testing. Please note that we will continue to use the size printed on the casing to refer to the tires as it is much less confusing than using the actual measurements, though the actual measurements will be important for determining optimal pressures. Also, 17c is the industry standard for a bead measuring 16.5 mm -17.5 mm. The Rim we are using is a 17c rim which measures 17.5mm, please consider them interchangeable for the purposes of this test.

Flat Surface Data
Our first study was just to look at the differences between 3 different tire widths on the same wheel with a 17.5mm inner bead at the same pressure.
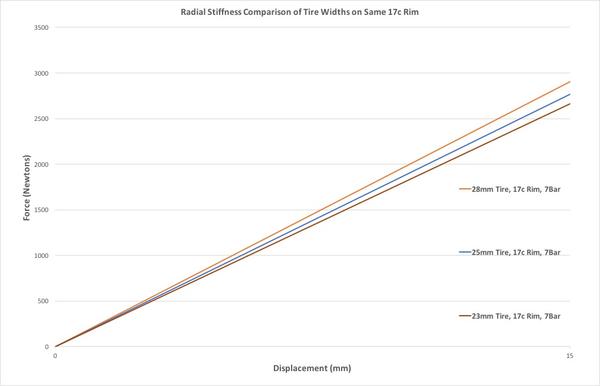
23, 25, and 28mm Tires on the Same 17.5mm Bead Width Wheel – Flat Surface
The first thing to notice here is that the wider tire (28mm) is actually Vertically Stiffer than the 25mm tire, which is in turn stiffer than the 23mm tire. The most common response we get to this graph is, ‘That’s not possible, I went from 23s to 28s, and it’s noticeably better.’
My initial thoughts about this were that the ‘Just Noticeable Difference’ which is the smallest change that can be accurately noticed by humans has been shown to be between 10 and 15% for ride stiffness (much of the work on this was done by Damon Rinard, mentioned in Part 1 and his work on this topic with Cervelo can be found HERE)..and the difference here between the 23 and 28mm tire is only about 8-9%.
I have often seen in testing that if a rider believes something to be true, he/she will very often ‘feel’ that in the test ride, particularly if the effect in question is relatively small. So based on this first piece of data, it would seem that perception and expectations may be driving some of the ‘wider is more comfortable’ beliefs (assuming the same tire pressures). However, there is clearly much more to learn.
So with this data in hand, we went about building a complete data sheet of all 3 tires at all 3 pressures on the 17.5mm Rim. We used 6Bar, 7Bar, and 8Bar (87 psi, 101 psi, and 115 psi) to build this data set as it gave us a large total range of pressures commonly run in tires of these sizes.

23, 25, 28mm Tires on Same 17.5mm Bead Width Rim at 3 Pressures – Flat Surface
This graph really helps set the stage for the relative differences we are looking at. As the tire pressures were changed in 1Bar increments (14.5psi) you can get a feel for the magnitudes of difference between the width changes, in this case increasing from a 23mm to a 28mm tire at 7Bar increased stiffness by 9%, while increasing pressure by 1Bar increased stiffness more than 21%. The data grouping is mostly dominated by tire pressure, so clearly, the effects of these 2-3mm width changes are below the 1Bar delta in pressure change used for the test.
To really take this study to the next level, we decided to not just push on the tires with the flat surface but to also look at a simulated cobble-stone (8cm radius) and a simulated pavement lip (8mm radius) to see what the effective stiffness of the tire would be against those surfaces.

Visualization of 3 Different Test Anvils Used for Testing
'Cobble' Surface (8cm Radius) Data
Here is the data for the same 3 tires on the 17.5mm Bead Width rim at the same 3 pressures; only the ‘anvil’ in the test machine is now a machined piece of steel with an 8cm radius to mimic the crown of a cobble.

23, 25, 28mm Tires on Same 17mm Bead Width Rim at 3 Pressures – Cobble Surface
Of note is that the rounded impact anvil, ‘the cobble’, resulted in a considerably lower force at the 15mm displacement than the flat surface. This is largely the result of how much of the tire is able to deform at the contact patch between the anvil and tire.
Interestingly, with the Cobble Impact head, the radial stiffness is still mostly dominated by tire pressure, though the differences between the tire widths and pressures have condensed somewhat. The shape of the object being pushed into the tire makes a large difference in the tire's stiffness. With this data set, we are beginning to see some overlaps; for instance, the 23mm tire at 8Bar is very nearly identical in stiffness to the 28mm tire at 7Bar.
'Pavement Lip' (8mm Radius) Data
Wanting to push this further, we looked at the same conditions with an 8mm radius anvil, which simulates a concrete lip, rock, or similar object that your tire may hit. As the radius of this anvil is considerably smaller than any of the tires, we were interested in seeing how the data would change. And, wow, did it change!

23, 25, 28mm Tires on Same 17.5mm Bead Width Rim at 3 Pressures – 8mm Radius
Look closely, and you will see that the results have completely separated out by air pressure and the different width tires have become almost identical to each other when at the same pressure. It would appear that for this small radius, the tire size is of little factor compared to air pressure.
So what has happened to drive this? It would seem that the changes in air pressure are making similar differences to previous studies, yet the tire width is not contributing in quite the same way. There is more to learn here for sure, but at this point, it seems that for bumps smaller than the tire diameter, the shape and size of the bump are driving the stiffness more than the effective width of the tire itself.
Please see the post-script to this paper about why we believe this to be true, but keeping it simple based on the data we’ve seen here, it certainly seems that wider tires are every bit as good or better at absorbing small bumps and imperfections than narrower tires at the same pressure. This is most certainly not the expected outcome of the study as we planned it when we started, but most certainly is a fascinating one!!
Converting it to Vertical Stiffness
Up to this point, we have been using the phrase 'Stiffness' to explain these graphs, which are actually Force-Displacement Graphs. Stiffness is actually defined by the slope of the line in the graph, but adding that made the graphs even messier and harder to read! Below are the actual calculated stiffness values from these tests. These values will become important in part 3, where we look at how the tire stiffness affects the ride quality of the entire bicycle system.

Vertical Stiffness of 3 Tires and 3 Pressures against 3 Surface Geometries
Summary and Recommendations
What we can say is that all those people who feel their larger tires are more comfortable, you may be correct for bumps smaller than 8mm radius...we could not measure that, so it is hard to know, but for larger radii, you are best to lower your air pressure a bit to truly take advantage of the larger tire widths.
The most exciting aspect of this study is that it has begun to point us in the direction of how much pressure we need to lose with tire width increases, and even better, it hints that while lower pressure will provide similar ride comfort on most surfaces, it will likely improve comfort on small bumps.
Our recommendation is that you decrease tire pressure by 2-3% for each millimeter of tire width increase. This will ensure similar compliance over most surfaces while providing improved compliance over small bumps and edges. Keeping a log of your pressure experiments will help you decide what pressures are ultimately most comfortable and most efficient for your weight and road surfaces. This will be important to know as we begin discussing Rolling Resistance and Aerodynamics.
Our next Tech Tuesday discussion will cover Ride Comfort and Compliance and how tire pressure and stiffness affect the entire bicycle system.
Post-Script
I have to say that at this point, we certainly don’t have the answers to the questions brought about by this data, but we consider it a reasonable theory that there is something happening at the interface between the small anvil and the tire, which is adding apparent stiffness to the smaller width tire data. This could be the result of casing stiffness, localized distortion, surface friction, or other factors. There is more work to be done on this.
Also, for the purpose of this study, we are only showing the force at 0 and 15mm of displacement. This is partly to keep the data clean but also to simplify the chart reading. We found for each test that the first few millimeters of displacement were non-linear, and then the graphs would become more or less linear. For the sake of keeping our sanity working with the data, we chose to assume that the curves are fully linear. However, with the 8mm anvil, the data showed a larger non-linear section, so this is likely due to the relatively extreme localized deflections and deformations required within the tire at these large displacements.
15mm was chosen as the deflection data point to ensure that none of the tires were beginning to bottom out on the rim. Past 15mm, the force data for the 23mm tires begins to bend upward as the casing deflections become extreme, and then inner-tube materials become pinched within the system. Taking stiffness data from 0-15mm deflection ensured that the force data represented the effect of the casing stiffness and the air spring only.